Transition to more sustainable transport

Introduction
The International Energy Agency has identified the main contributions to carbon emissions (GHG) is electricity at 42%, transportation at 23% and industry at 19%. And unlike other sectors the carbon emissions from transportation have only marginally reduced despite improvements in efficiency, electrification, and use of alternative fuels. It is not just emissions, it’s the air pollution and particulate matter (PM) such as carbon monoxide (CO), hydrocarbons (HCs) and nitrogen oxides (NOx) that produce various degrees of toxicity and potential cancers. Making real reductions in climate change impacts will involve a shift to electric vehicles (EVs), public transportation (PT), cycling and walking. Transportation is critical to the global economy facilitating economic growth and productivity as well as improving people lives through access to jobs, health, education and other services. There is therefore a need to simultaneously increase access to mobility and reduce its climate impacts.
Relative travel times of car and PT
Travel time by car is typically lower than using PT, in most cities. The longer the travel time for PT, the more attractive car travel becomes and the lower the PT mode share and further reduced when commuters have access to free workplace parking. If travel times are broadly similar, PT becomes an attractive proposition. Factors that commuters take into account in determining modal choice are travel time ratio, convenience, cost, frequency, transfer vs direct route, proximity to origin and destination stops, reliability and socio-economics status, but trave time and cost seem to have biggest impact. IN Oslo, the capital of Norway, the PT mode share was highest when travel time ratios (PT travel time/car travel time) were less than 1.5; a significant drop off when travel time ratio exceeded 2 and a further drop off when the travel time ratio exceeded 3. Similar observations were observed in smaller cities but with a lower PT share overall.
Comparison of energy use in transportation
The Odyssee-Mure project is a European Union (EU) research project that monitors energy use and emissions from different transport modes across the EU. This show that in 2019, cars required almost 2.2 times more energy per passenger-km than buses, and 7.3 times more than rail transport. Domestic air transport is more than twice the energy intensity of cars and 15 times more intensive than rail. Emissions from cycling and walking depends on the emissions produced by the food we eat, beef being highest and bananas, potatoes and nuts being lowest.

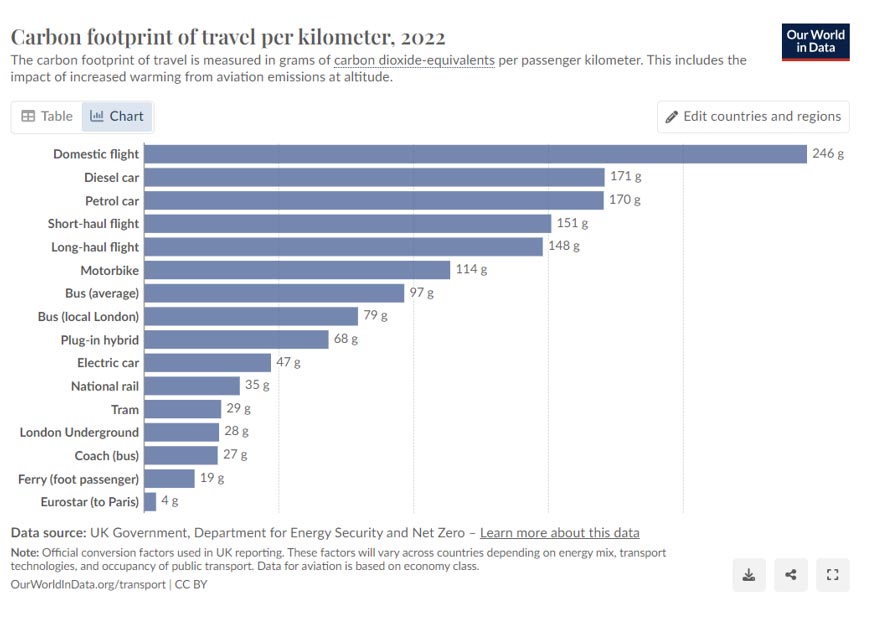
Comparison of emissions from transportation
A 2022 study of carbon footprint from different mobility modes by the UK Government, Department for Energy Security and Net Zero, reported that National rail emits approximately 35 grams of CO2 per km and petrol, or diesel fuelled cars emit approximately 170 grams per km.
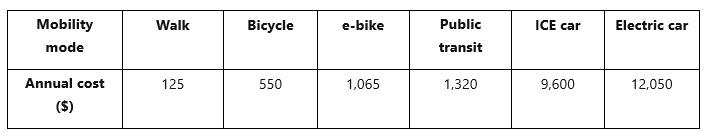
Cost of various modes of transportation
Despite the big differences in income and costs across countries, there is a strong correlation in the percentage of household income spent on transportation which typically range between 13% and 16%, although our own studies show it can reach 30%+ outside urban areas and in lower income groups. There are very few recent comparative studies of the cost of transportation across different modes but a European Environment Agency study in 2016 covering UK, Denmark and Finland showed that over a 20-year period the cost of car ownership had remained stable in both UK and Denmark whilst bus and rail fares had increased more rapidly ~ 30% in the UK and more than 50% in Denmark. Whilst a full set of data is not available EU-wide it is considered representative of the EU as a whole. The outlier is Finland where the cost of car ownership increased substantially, but in line with bus and rail fares. Data from Australia (see table) shows the relative cost of a subset of mobility modes. Relative costs particularly of EV are changing rapidly and may not be current at the time of writing. Also, the costs will vary from country to country.
Growth of Public Transport in Indonesia?
Indonesia has been investing heavily in mass PT for more than two decades (see table). Jakarta has pioneered the relatively low cost Transjakarta BRT system first opened in 2004. It is now the largest BRT system in the world, carrying more than 1 million passengers per day and is supported by a feeder system of local buses. More recently Jakarta has developed the first phases of MRT Jakarta, LRT Jabodebek and LRT Jakarta with plans for further extensions over the coming years. Other cities are building PT networks with an emphasis on less expensive BRT systems.
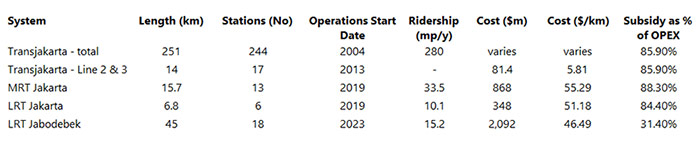
The increasing share of PT has been made possible by bilateral and multi-national loans, repayable on a long-term basis. The adoption of PT has been facilitated by national and provincial subsidies which range from 31% to 86%.
Key factors influencing growth of more sustainable transportation
Costs and Financing
- Farebox is insufficient to pay back capital investment.
- Cross-subsidies are necessary to make PT attractive for lower income groups.
Energy Transition
- Electrification reduces emissions.
- Transition to EVs reduces emissions.
Integration for improved Quality of Services
- Network integration to deliver shorter travel times.
- Feeder services for widen area coverage.
- First and Last Mile connectivity makes PT more attractive.
- Use Technology for more informed decisions.
- Integrated multimodal transit hubs reduces travel times.
Solution Beyond Transit
- Push and Pull Strategy
- Phased Implementation will help accelerate modal shift.
- TODs helps drive patronage and vice versa
- Promotion of active mobility through better and safer public realm improves health and reduces emissions.
While EVs generate fewer life-cycle emissions than internal combustion engines, there are additional factors in battery production supply chain emissions which result in 35% to 50% higher emissions than for internal combustion engines.
There is an inherent distortion in the way transport costs are distributed across mobility modes, only partially alleviated by PT subsidies. Reform of the way mobility is priced will be essential over the next decade as the EV market share increases and the revenue receipts from hydrocarbon fuels decrease.
Achieving sustainable transit requires a comprehensive and integrated solutions beyond just transportation.


